The Startup Guide to Analytics
You can't improve what you can't see. This guide will help you see :)
by
June
If you’re not tracking the value of something you do, you’re just acting on gut instinct. Without analytics, you don’t actually know if your next feature is going to help your startup. You’re just guessing.
This guide will just help you get started with analytics and help you understand only the basic concepts and lingo you need to track your startup’s growth and your users' engagement. The subject of analytics is deep and complicated. Consider this guide to be your first step.
We'll use the website below as an example for the guide. It's built using Next.js and we've gone ahead and instrumented the website to track everything we need, so feel free to check out the source code (you can drag the little slider on the left of the web page) or follow the guide as we explain what everything means.
0 points
Introduction
There are three critical metrics you need to track for any startup
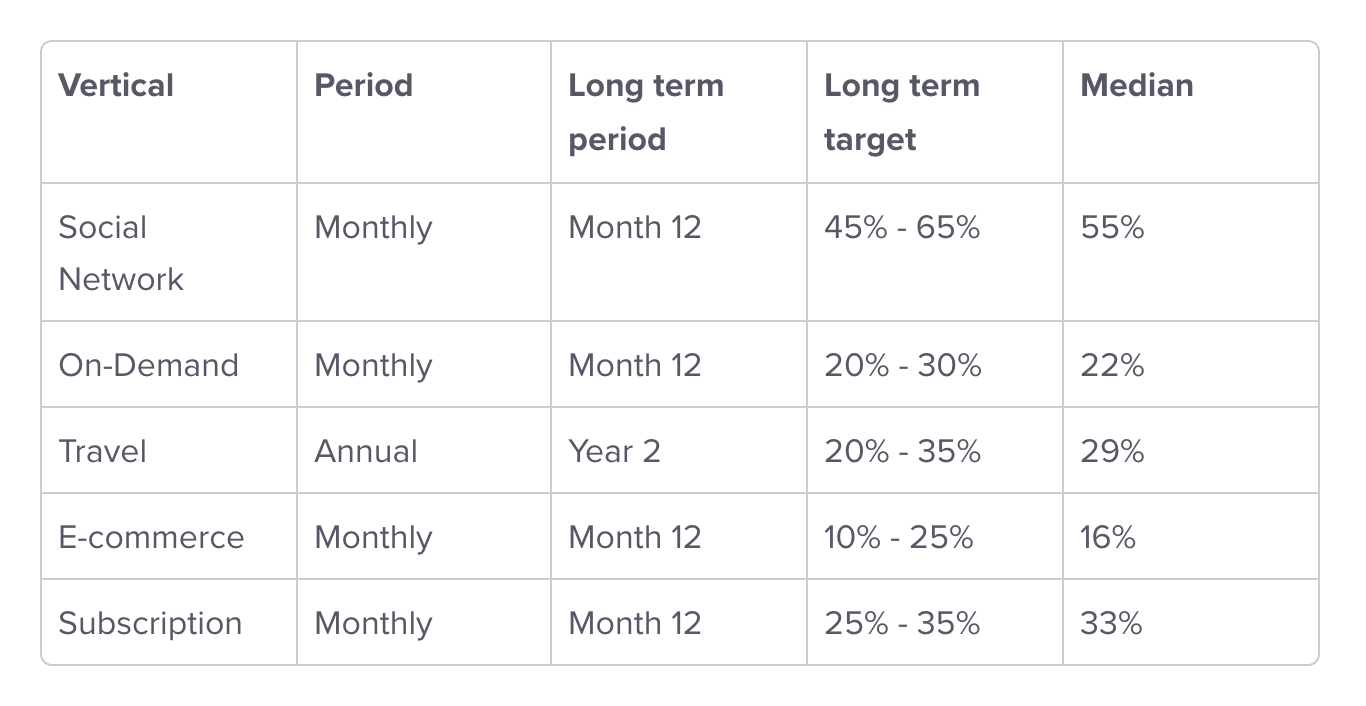
- Retention Track how long users keep coming back to your product. For Subscription businesses, it is essential to understand why your users churn. It is useful for other businesses to know why users come back, especially why other users don't. Until you haven't got your retention to 20% you shouldn't measure anything else. Here's a table with common benchmarks:
Engagement Track of how users engage with different features of your product. By adding events for the different features on your products, you can track which features are more important to users than others.
- Tracking features used by your retained users, you can identify which ones should be prioritized and which ones you should kill.
- Tracking features used by the users that don't stick, you can identify discovery gaps in your product.
- Conversion Follow the journey that people take from learning about your product to becoming an active or paying user for your product. The activity you want your prospective customer to perform is your conversion goal. You can have multiple goals for different products/markets or marketing campaigns. Still, it's essential to have high intent (i.e., once that shows a customer is very interested in your product). More on this later.
Retention
This is arguably the most critical metric, and it requires the least amount of effort to track. Once you have conversion and engagement tracking in place, you don't need any additional tracking to measure retention. Instead, retention is just a matter of setting up the proper graphs and cohort analysis on your analytics tool.
Retention tracking lets you identify when users churn (i.e., stop using your product). This is incredibly important for any subscription service. Still, even for other businesses like an e-commerce website, it's essential to know what makes users return to the website and, more importantly, what makes users leave.
With retention, we just need to answer a few important questions:
1. What percentage of new users are we retaining after 1 month?
2. On average, how long does a customer stay active before churning (This can be inferred from the previous question)
June's cohort table allows you to zoom into users in each cohort
3. What factors affect retention. This is where engagement metrics can truly help. Suppose you notice that users of a certain feature, or people in a certain payment plan, have a longer retention cycle. In that case, that's a feature worth advocating.
4. What makes users tick, and what makes users leave. This is the same point as above, but sometimes the answer is subjective. You can use a tool like [June](https://june.so/) to identify churned/active users and then reach out and interview them to learn what happened.
Engagement I
Engagement metrics depend heavily on what your business is. For example, if you're running a SaaS business or a productivity app of some kind, then this involves tracking how your users interact with features on you app. If your product is an e-commerce app, then it's about tracking what products/categories do well and how users interact with features like "Search" and "Similar Items" (If they can't find it, they can't buy it).
For RentACat, there are a few things we want to know when it comes to engagement:
Renting a Cat - We already have this event tracked from the conversion funnel. For engagement, it's also important to keep track of this event so we know how many cat rentals are made on our website.
Popular Cats - If some cats are rented far more often than others, then it's really useful to know which ones and why. Maybe female kittens are more popular, or just ones that have photos of cats wearing clothes. There are machine learning tools to help you automate and optimize product listings, but it's really easy and important to get a sense of this as the CEO of RentACat. It also makes for a great example of engagement analytics.
"Recommended Cats" Usage - How often are people using this feature, and are people using it more or less likely to actually convert. If it has no impact on conversion, we can remove this feature entirely
"Search Cats" Usage - Same reason as above, but we can't "remove it entirely" if isn't working. It's more likely that our search algorithm is flawed. The only way to know for sure, is to figure out if it's working, and if it's not, grab search terms from users who did a search but did not convert, and make those search queries yourself. You'll quickly understand what's going wrong
Engagement II
Tracking these events works just like before. Add .track() calls for the actions we need to track, and make sure to include the required properties on those events. Feel free to check out the source code for some examples.
Fun Fact: There are additional engagement actions that are not easy to track yourself. For example, posting on a Canny.io board, or interacting with support over Intercom, or just adding a card to Stripe but not checking out. June can extract these analytics events for you.
Over on the analytics tool of your choice, we can make a simple bar graph or line chart to see how these features do. For example, a here's a bar graph that compares the number of people that converted without doing "Search Cat" and those that converted after doing it.
Conversion from users who use the search bar vs. users who don't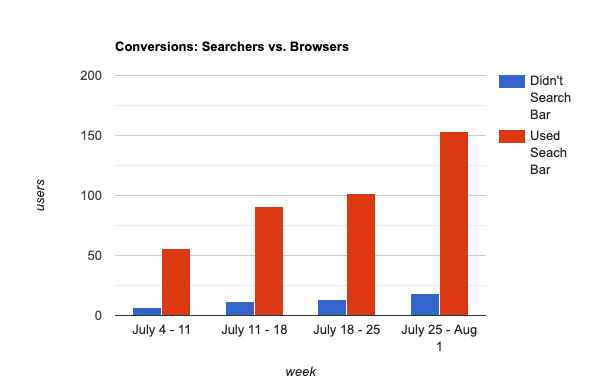
However, be weary of a graph like this. Think about this way. If users who used the search bar feature convert more, it doesn't necessarily mean the search bar caused them to convert. It could just be that people seriously interested in renting a cat tend to use the search bar, but a lot of people are visiting the website to see how it works before leaving - and they were never actually going to rent a cat. There just happens to be a correlation. This is famously known as the "Causation vs. Corelation" paradox.
Causation vs. Correlation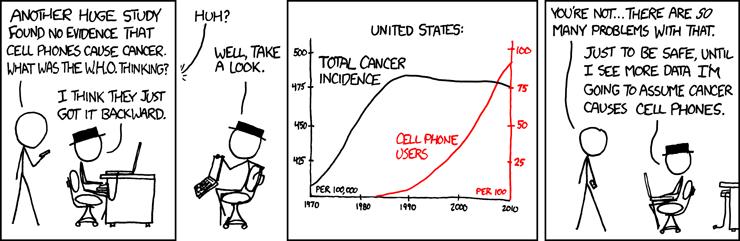
However, if you find that a smaller percentage of "search bar users" convert than those that don't use the search bar, that definitely raises some red flags.
This is actually the perfect example of a metric you should "track but not watch". i.e. you only want to know when something seems off, but isn't something you necessarily need to optimize for. It can be really subjective, but spend a few minutes thinking about the metrics you track with context. You wouldn't want to waste time on the wrong features at this stage.
Engagement Conclusion
There isn't much more this guide will go into when it comes to engagement. Ultimately engagement metrics are highly dependent on your business model, the features you want to track and the goal you're hoping to achieve by tracking something.
For starters, make sure you at least have tracking code for any key action (on RentACat, this was the act of actually confirming a cat rental). This lets you track how active your users actually and is the basis of MAU/DAU (Monthly/Daily Active Users) measurements, and ultimately your sales/revenue/etc.
Whenever you ship a new feature, think about the metric(s) that will help you gauge the features performance and make sure to add necessary tracking code. Once you have the tracking, you can graph it however you'd like on your analytics tool later.
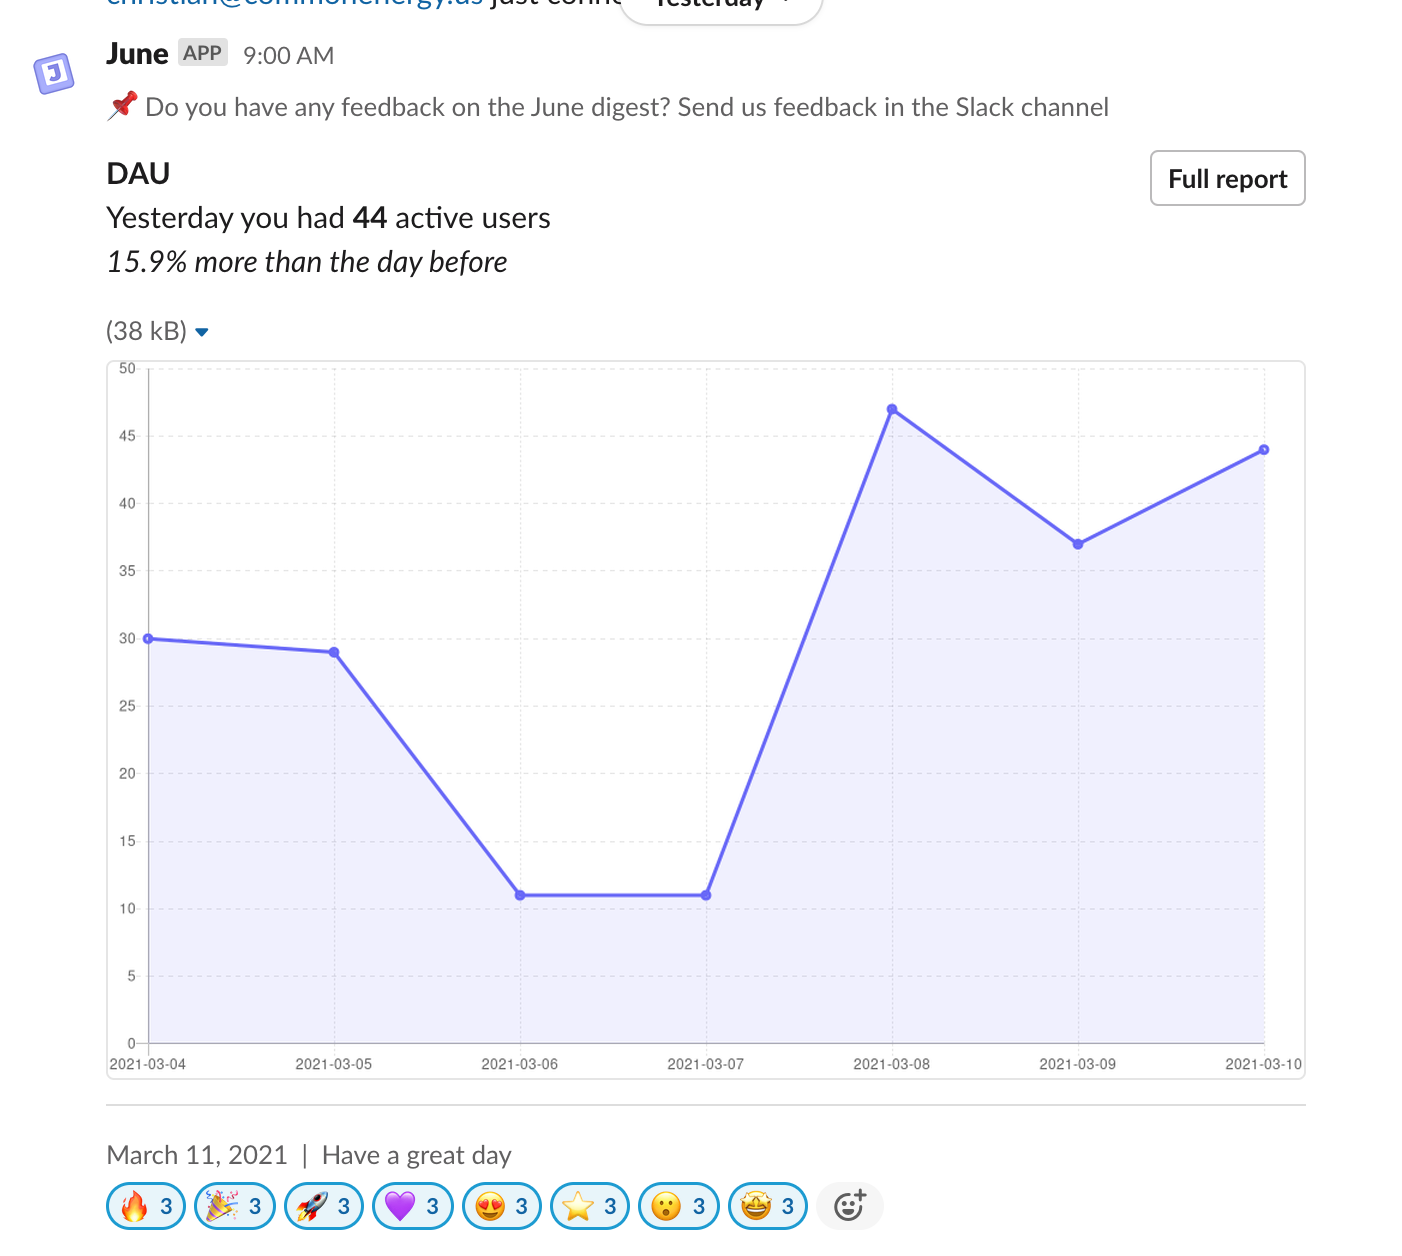
Pro tip If you're using June you can add these tracking events to your Active users report and receive a daily update in Slack that looks like this
Conversion I
For this tutorial, we'll use the RentACat website above as an example. RentACat is a service that lets its users rent a fluffy companion on demand for only $9.99/day.
There are many ways a new user may show up on the RentACat landing page. The first step is to understand where they came from. This is called Attribution and it's really easy to get started by just dropping in a Google Analytics snippet to the website. See lines 46-58 for how we did that with RentACat, which is a Next.js app. You'll need to add this code within the <head>...</head> tags on your own website.
Once you include the Google Analytics snippet to your website and start receiving web traffic, you can visit the Google Analytics dashboard to see your Attribution data
Attribution on Google Analytics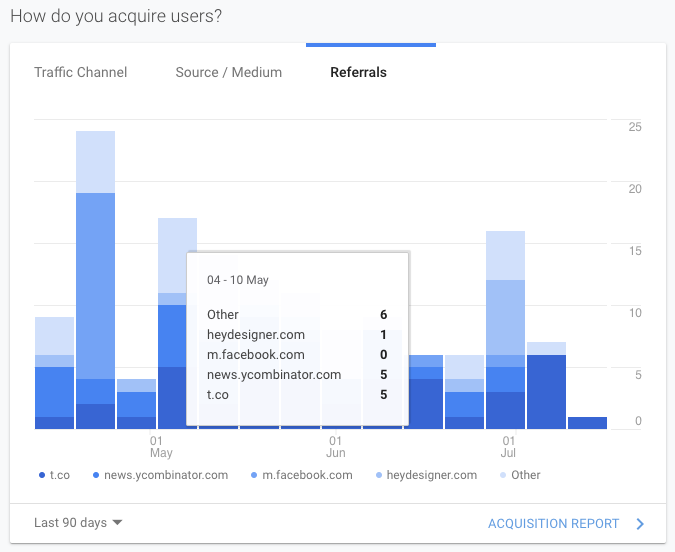
Tracking Attribution is only the start, but it's a great way to figure out what channels work great for your product, and where your ideal customers are. When you're just starting out, it's helpful to keep running experiments by posting about your startup on different places and attempting various marketing campaigns. By tracking attribution, you can see what's working and what's not.
Conversion II
After setting up attribution, it's really important to define a Conversion Goal. This is a specific action that any visitor to your website must perform before they can be considered a customer. There are often multiple steps along that journey for a new customer, but we'll start by defining that final, most important event that makes someone a customer.
Multiple paths to a single conversion goal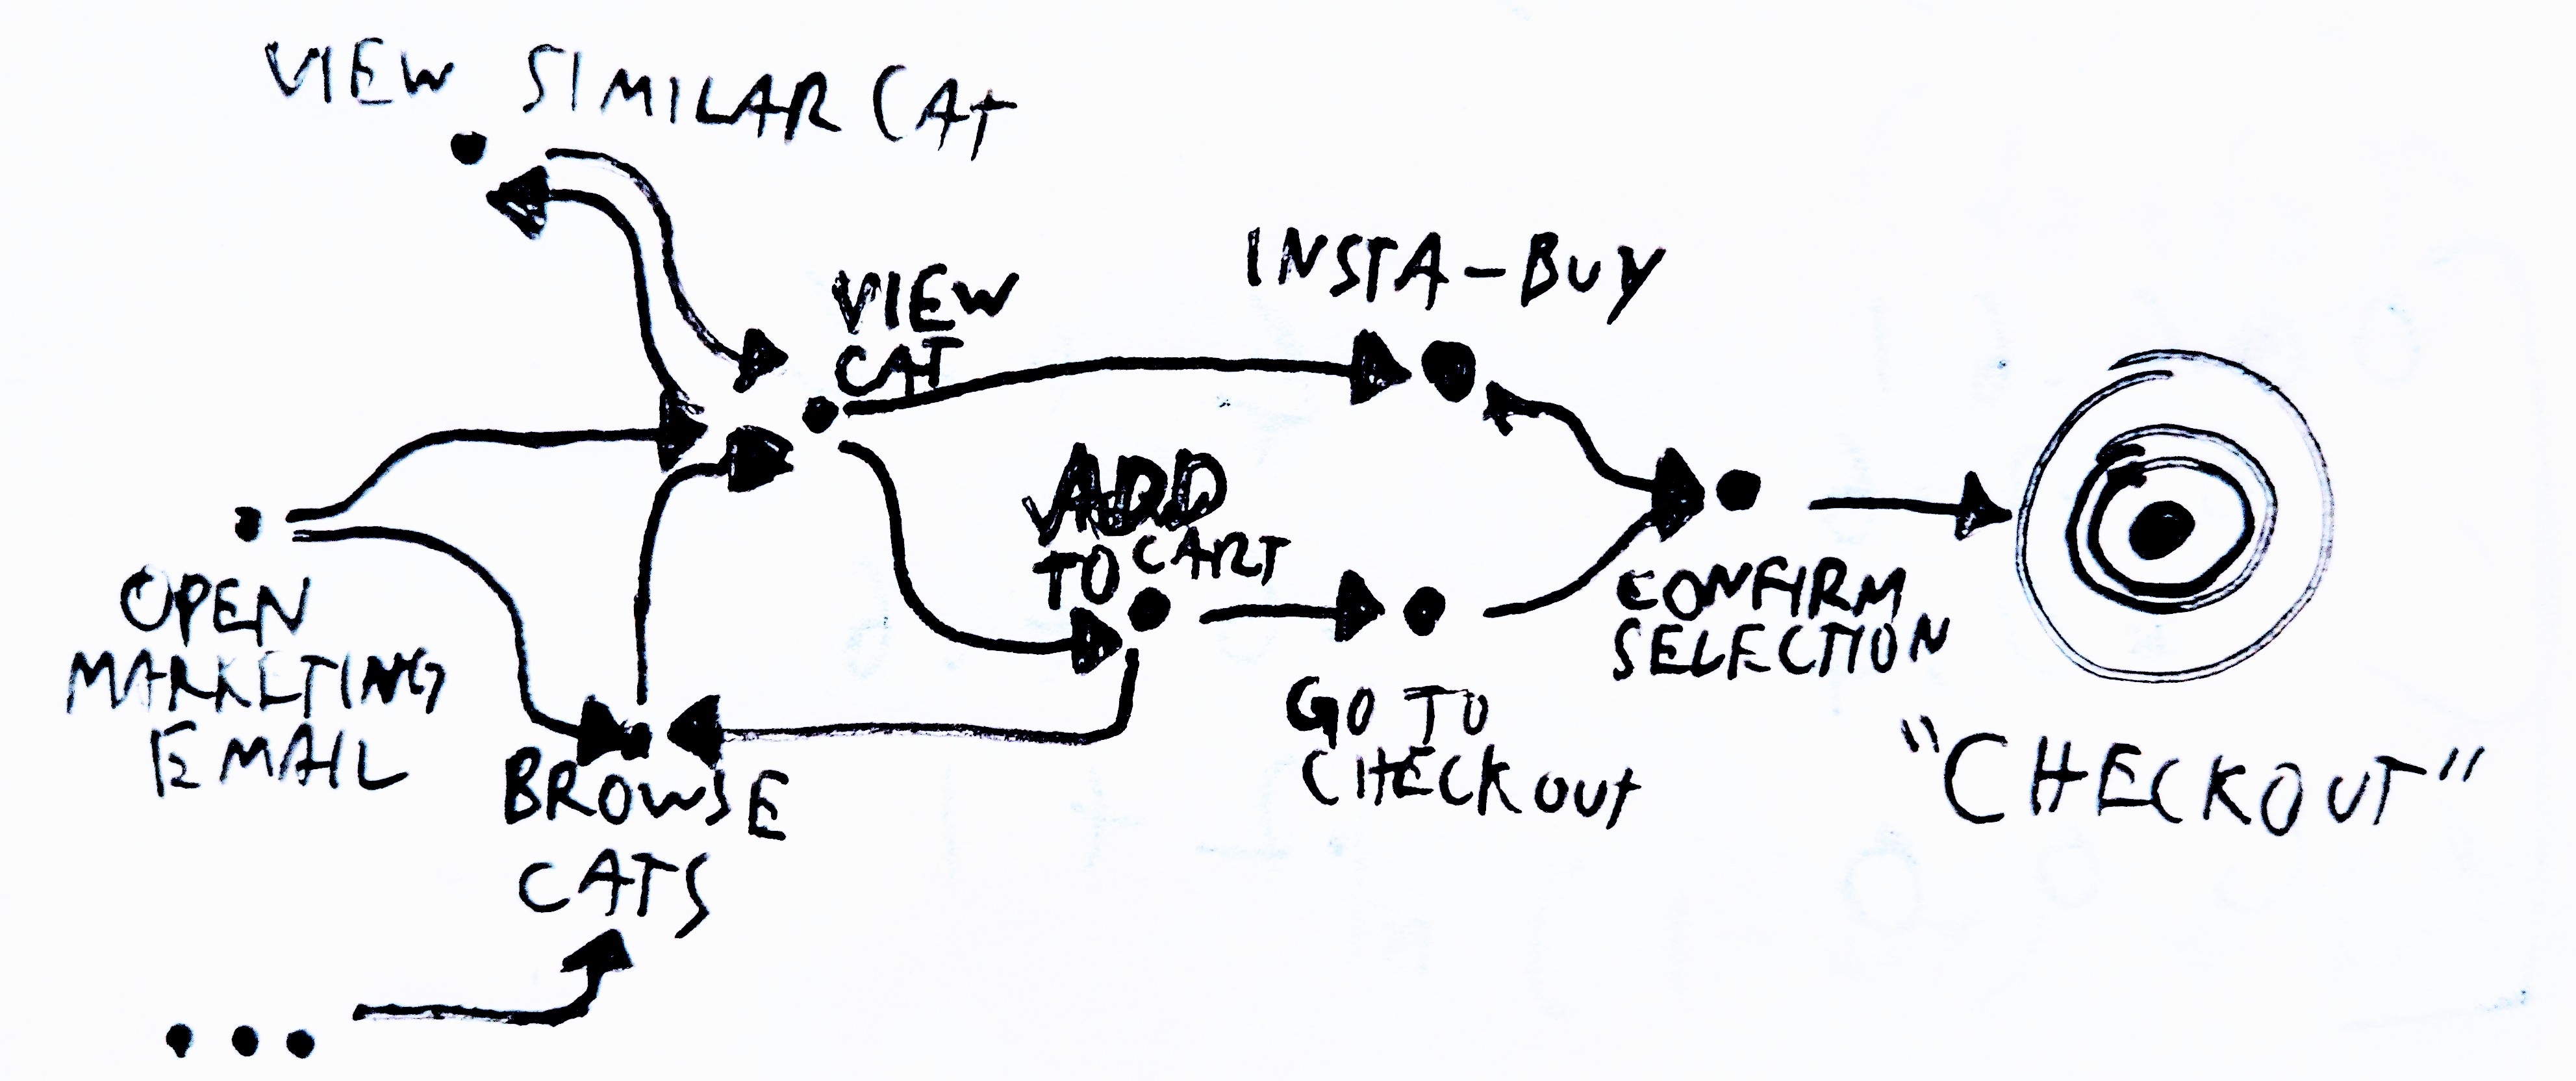
You need to identify a high intent action as the conversion goal. It's tempting to just choose "Sign Up" and call it a day, but that would be misleading. Let's look at some examples:
For a product like Instagram, the conversion goal might be posting a picture. For YouTube, it could be watching your third video. Until a user hits the conversion goal, your only goal is to nudge a user along the journey and get them there. This is the big advantage of picking a high intent action - it's always clear to you what the user should do next and you can translate this into your product, removing distractions along the way. Moreover, when someone accomplishes that action - you know that they've really experienced your product (i.e. you can now stop marketing the product to them and work on engagement).
For your product, find that pivotal event that defines a "customer". While you can and probably will change this in the future, it's good to pick this with careful thought because it completely defines your marketing strategy (The goal for marketing is always to increase this number).
Once you find your conversion goal, don't worry if you see a really low number of customers who've actually completed the Conversion Goal - that's kinda of the idea at an early stage. You can improve that number from here on out.
For RentACat, let's make it our goal to get a user to rent their first cat. We'll track the journey along the way and identify what causes users to drop off earlier so we can improve the funnel.
Conversion III
We start by tracking the actual checkout action so we know when a visitor makes it to that point. This is the point at which they became a customer.
Note: All code examples on this guide use the Segment for Node SDK. You're free to use any other server-side Segment SDK or the corresponding SDK for your analytics tool.
We add this line to the checkout endpoint on the API.
analytics.track({ event: "Rented a cat" });
While you can do this on the frontend, it's far more reliable to do mission critical tracking on the server. Browsers can drop events due to network issues and browser extensions can block tracking code.
Alright! We now know when someone rents a cat, but we don't know who did it. That's easy to fix by adding their ID to the event. While we're at it, we can also add some other properties about the cat
analytics.track({
  event: "Rented a cat",
  userId: loggedInUser.id,
  properties: {
    name: "Henry",
    age: 2,
    color: "brown",
  },
});
Conversion IV
Once you have your tracking code in place (and if you're using Segment, you've connected an analytics destination like Mixpanel, Heap or Amplitude), head over to your analytics tool. Once there, create a new funnel to track how many visitors to your website actually make it to renting a cat.
Note: This guide won't go into setting up a funnel on your analytics tool since each tool has its own interface to do that. Read the documentation of your analytics tool of choice to figure this out. Or just use the June funnel report
After collecting data for a little while, you'll notice the percentage of converted users through the funnel is small, but we can't start optimizing yet since we don't know where in between those events they're dropping off. To do that, we need to track every required step in the journey from visiting the website to conversion.
For RentACat, it looks like:
1. Visit Website
2. Enter Email on Signup Form
3. Finish Account Creation*
4. Enter Address
5. Browse Cats
6. Select a Cat
7. Schedule Pickup
8. Enter Credit Card Details
9. Confirm Rental
This might seem like a long funnel and you can likely skip tracking some steps, but it turns out that tracking every required step is incredibly useful. You might find a lot of users dropping off at a point they should not be. For example, if too many users are dropping off after "Browse Cats", before "Select a Cat", chances are there's a bug to fix. Maybe the Cat Details page doesn't work well on their mobile device, or you're showing something on the "Browse Cats" screen (like a picture of a cat being abused) that is clearly turning people off at that point. You can optimize each step of the user journey only if you're collecting data on dropoffs. In other words, you can't improve what you can't see.
*You can identify the user at this point. This way you can provide tools like June with all the information it needs for each user and you can track someone's journey through onboarding even if they leave and log back in much later. Read the Segment docs for best practices on the identify method.
Conversion Conclusion
Tracking conversion is easy and incredibly useful as an early startup. Simply dropping in Google Analytics will tell you how many people make it to your website and where they come from, but the story of what makes them pay is much more involved. Knowing the exact journey a user must take and understanding where they might drop off is critical to growth
Note that we only tracked the onboarding steps that are required for someone to convert. In other words, every step in the funnel requires the previous step to happen first. This is essential when setting up a funnel, but you may have other optional events - i.e. actions that a user might perform that don't need to happen for them to convert.
Tracking optional steps in between is useful too, so you know what helps in getting a user to convert. For example, if 50% of users make it from "Select a cat" to "Schedule pickup", but 80% of users make it from "Select a 'similar' cat" to "Schedule pickup", then you know that users who interact with the "similar cats" feature are far more likely to convert. It's not a required step in the process, but it lets you know that your feature is particularly useful and you should push that feature to the top of the page. Don't add optional steps to your core funnel, but setup additional graphs for this kind of thing. Bar graphs are great for this.
Note: It's also possible to have multiple onboarding funnels. For example, in SaaS, there's often a funnel for new accounts being created, but also a different funnel for teammates invited to an account who can often skip certain steps like account creation. Make sure to account for all your onboarding flows and setup individual funnels on your analytics tool to track these.
End
Hopefully this guide helps you get started with analytics. Analytics was a confusing subject when we started implementing our own tracking and learning what to graph and how to do it. We made this guide to share what we learnt along the way and to help other startups get started with optimizing their own growth.
However, analytics is useful for much more than just growth - it helps you actually understand your user base. Talking to users early on is important and tracking code can help you identify who to reach out to and what questions you need to ask them.
We'll keep updating this guide over time, and we'll transfer more of our learnings about analytics from this guide into our product. June will identify potential issues with your tracked events and recommend fixes, additional events and graphs that will be useful for you. We hope you'll give it a shot 🚀
If you have any feedback on this guide feel free to email me at ferruccio /at/ june /dot/ so
Credits to
for writing the initial version of this guide